Over nearly a decade of coaching and long-course racing, I have anecdotally observed two things about bike courses on the North American Ironman circuit: (1) the relative speed of the course does not always correlate to its elevation gain, and (2) the time differential between two courses is not necessarily the same when comparing athletes of different speeds.
So after years of yearning for an Ironman bike course conversion calculator to appear on the Interweb, I finally gave up and ran some calculations myself. While the following experiment wouldn’t win any prizes at a middle school science fair, it does provide insight into the relative differences in predicted bike splits for the North American Ironman bike courses and across a wide range of athlete profiles.
My experiment is detailed below. Feel free to skip straight to the “Results” and “Conclusions” sections if you do not need to revisit middle school.
Questions
1. Can an athlete’s relative bike split across two Ironman bike courses be predicted by the relative elevation gain of the course?
2. Is the bike split differential for two Ironman bike courses the same for all athletes?
Hypothesis
No, and no.
Procedure
Given that riding all the courses myself while holding variables like weather and fitness constant seemed like a monumental project, I turned to Best Bike Split to simulate these rides for me.
My Best Bike Split bike profile was quite accurate, thanks to their prior support and guidance, so I began with that profile, a roughly 2.6 W/kg FTP, a bike IF of 0.70, and a max FTP of 80% to arrive at my first athlete profile. I specifically chose this first profile to arrive at a “base” bike split on flatter bike courses of about six hours and with a TSS just below 300. I used this athlete profile to run splits for all of the bike courses on the North American Ironman circuit, including a few discontinued venues. That was my first column of data.
To achieve a wider range of athlete profiles, I adjusted the FTP both up and down, holding IF constant and modifying max FTP percentage slightly to maintain a TSS just below 300 for faster athlete profiles or to hit the target “base” time for slower athlete profiles. This range of athlete profiles produced “base” bike splits on flatter courses spanning from five hours to seven hours in 15-minute increments. I then ran bike splits for each of these athlete profiles across the full list of races to complete the data set.
Finally, I sorted the data by elevation gain for each course. I graphed the data and calculated the total range in bike course durations for each “base” bike split as well as the percentage difference for each bike course relative to the “base” bike split.
Sources of Error and Side Notes
1. Changing both watts and kilograms within my athlete profile to simulate different athlete profiles created massive swings in bike splits, so I held kilograms uniform and only changed watts. This likely requires further investigation and data analysis.
2. Best Bike Split lists multiple versions of nearly every Ironman bike course; for a few courses (Tulsa, Coeur d’Alene) the versions yielded substantially different splits for the same athlete profile. I did my best to pick an accurate version of each course; verified courses would improve the accuracy of the experiment.
3. Only the most recent version of a venue’s bike course was used in the analysis.
4. No adjustments were made for acclimation to altitude or lack thereof.
A list of the Best Bike Split data sources used for this analysis appears at the end of this article.
Results
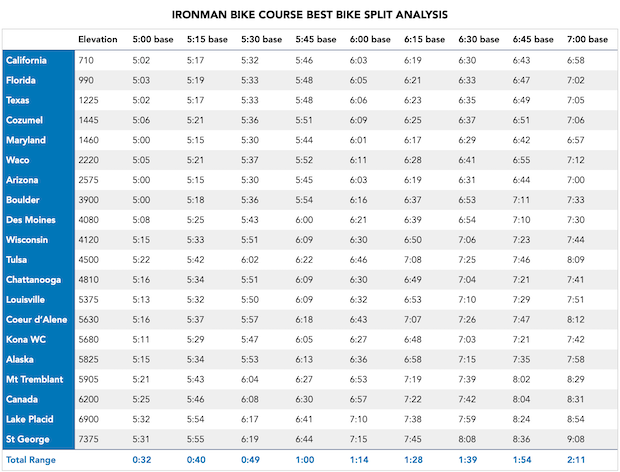
The following charts detail the data collected within the experiment. The first table shows predicted bike splits for each athlete profile on each bike course, organized by column for each “base” bike split and sorted by bike course elevation gain.
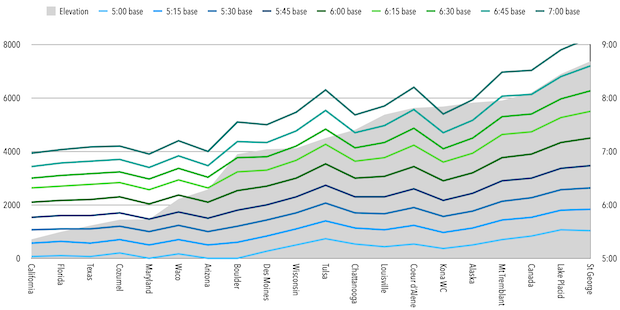
Here's the same data set, but in graph form.
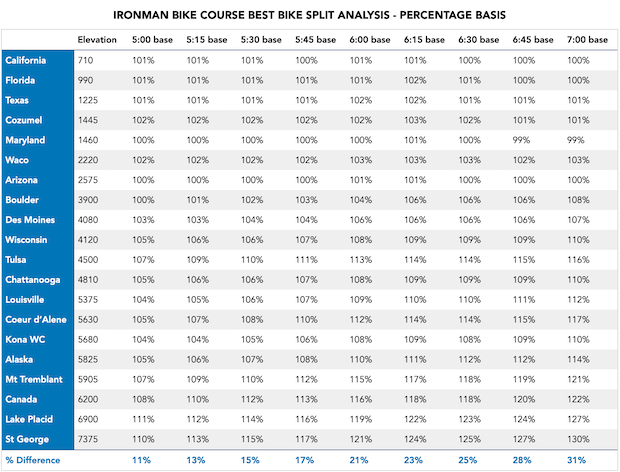
Finally, the second table translates each bike split to a percentage of the “base” bike split, again organized by column for each “base” bike split and sorted by bike course elevation gain.
Conclusions
Based on the data, one can reasonably conclude that my anecdotal observations were accurate and my hypotheses were correct: (1) an athlete’s relative bike split across two Ironman bike courses cannot be predicted by the relative elevation gain of the course; and (2) the bike split differential for two Ironman bike courses is not the same for all athletes.
While elevation gain does very generally predict the relative speed of an Ironman bike course, it does not predict it perfectly. In fact, several courses notably deviate from the general relationship between elevation gain and speed, including Arizona, Tulsa, Coeur d’Alene, and Kona.
Additionally, while bike courses with more elevation gain are typically slower for all athletes, the difference in predicted splits increases substantially as you move from five-hour to seven-hour “base” bike splits. This is true both in absolute duration and in percentage increase from the “base” bike split: slower bike courses are even slower for slower cyclists.
In conclusion, while further analysis would be necessary to create the Ironman bike course conversation calculator of my dreams, my experiment does provide insight into the relative speed of bike courses on the North America Ironman circuit, both with regard to elevation gain and athlete profile. And while not perfectly predictive, this data can be useful for triathletes as they evaluate future race options, particularly for athletes with “base” bike splits of six hours or longer.
Alison Freeman is a co-founder of NYX Endurance, a female-owned coaching group based in Boulder, Colorado, and San Diego, California. She is also a USAT Level II-certified and Ironman University-certified coach as well as a multiple iron-distance finisher.
Data Sources
IM California
2021 IM Florida
2017 Ironman Texas
2015 Ironman Cozumel
2014 Ironman Maryland
2021 Ironman Waco
2015 IM Arizona
2018 IM Boulder Full
2022 Ironman Des Moines
2022 Ironman Wisconsin
IM Tulsa 2022
2016 Ironman Chattanooga
2018 Ironman Louisville
2016 Ironman Coeur d’Alene
Ironman World Championship Kona
2022 Ironman Alaska
2018 Ironman Mont Tremblant
Ironman Canada Penticton 2020
2018 IM Lake Placid
IM St. George 2022 Final
